Topics
Introduction to Micro and Macro Economics
Micro Economics
Macro Economics
Utility Analysis
- Utility
- Types of Utility
- Concepts of Utility
- Relationship Between Total Utility and Marginal Utility
- Law of Diminishing Marginal Utility
- Assumptions of Diminishing Marginal Utility
- Exceptions to the Law of Diminishing Marginal Utility
- Criticisms of the Diminishing Marginal Utility
- Significance of the Diminishing Marginal Utility
- Relationship Between Marginal Utility and Price
- Diminishing Marginal Utility
Demand Analysis
Elasticity of Demand
Supply Analysis
Forms of Market
Index Numbers
National Income
- Concept of National Income
- Features of National Income
- Circular Flow of National Income
- Different Concepts of National Income
- Methods of Measurement of National Income
- Output Method/Product Method
- Income Method
- Expenditure Method
- Difficulties in the Measurement of National Income
- Importance of National Income Analysis
Public Finance in India
Money Market and Capital Market in India
- Financial Market
- Money Market in India
- Structure of Money Market in India
- Organized Sector
- Reserve Bank of India (RBI)
- Commercial Banks
- Co-operative Banks
- Development Financial Institutions (DFIs)
- Discount and Finance House of India (DFHI)
- Unorganized Sector
- Role of Money Market in India
- Problems of the Indian Money Market
- Reforms Introduced in the Money Market
- Capital Market
- Structure of Capital Market in India
- Role of Capital Market in India
- Problems of the Capital Market
- Reforms Introduced in the Capital Market
Foreign Trade of India
- Internal Trade
- Foreign Trade of India
- Types of Foreign Trade
- Role of Foreign Trade
- Composition of India’s Foreign Trade
- Direction of India’s Foreign Trade
- Trends in India’s Foreign Trade since 2001
- Concept of Balance of Payments (BOP)
Introduction to Micro Economics
- Features of Micro Economics
- Analysis of Market Structure
- Importance of Micro Economics
- Micro Economics - Slicing Method
- Use of Marginalism Principle in Micro Economics
- Micro Economics - Price Theory
- Micro Economic - Price Determination
- Micro Economics - Working of a Free Market Economy
- Micro Economics - International Trade and Public Finance
- Basis of Welfare Economics
- Micro Economics - Useful to Government
- Assumption of Micro Economic Analysis
- Meaning of Micro and Macro Economics
Consumers Behavior
Analysis of Demand and Elasticity of Demand
Analysis of Supply
Types of Market and Price Determination Under Perfect Competition
- Market
- Forms of Market
- Market Forms - Duopoly
- Equilibrium Price
Factors of Production
- Factors of Production - Land
- Factors of Production: Labour
- Factors of Production: Capital
- Factors of Production - Feature of Capital
- Factors of Production - Organisation
Introduction to Macro Economics
- Features of Macro Economic
- Importance of Macro Economic
- Difference Between Mirco Economic and Macro Economic
- Allocation of Resource and Economic Variable
National Income
Determinants of Aggregates
- Total Demand for Good and Services
- Concept of Aggregate Demand and Aggregate Supply
- Consumption Demand
- Investment Demand
- Government Demand
- Foreign Demand
- Difference Betweeen Export and Import
- Effect of Population of Consumption Expediture
- Types of Investment Expenditure
- Micro Eco-Equilibrium
Money
- Meaning of Money
- Type of Money
- Primary Function
- Secondary Functions
- Standard of Deferred Payment
- Standard of Transfer Payment
- Money - Store of Value
- Concept of Barter Exchange
- Difficulties Involved in the Barter Exchange
- Monetary Payments
- Concept of Good Money
Commercial Bank
Central Bank
- Definition - Central Bank
- Central Bank Function - Banker's Bank
- Central Bank Function - Controller of Credit
- Monetary Function of Central Bank
- Non Monetary Function of Central Bank
- Method of Credit Control - Quantitative
- Repo Rate and Reverse Repo Rate
- Central Bank Function - Goverment Bank
Public Economics
- Introduction of Public Economics
- Features of Public Economics
- Meaning of Government Budget
- Objectives of Government Budget
- Features of Government Budget
- Public Economics - Budget (1 Year)(1 April to 31 March)
- Types of Budget
- Taxable Income
- Budgetary Accounting in India
- Budgetary Accounting - Consolidated , Contingency and Public Fund
- Components of Budget
- Factor Influencing Government Budget
Notes
Law of Demand :
Introduction :
The law of demand was introduced by Prof. Alfred Marshall in his book, ‘Principles of Economics’, which was published in 1890. The law explains the functional relationship between price and quantity demanded.
Statement of the Law :
According to Prof. Alfred Marshall, “Other things being equal, higher the price of a commodity, smaller is the quantity demanded and lower the price of a commodity, larger is the quantity demanded.” In other words, other factors remaining constant, if the price of a commodity rises, demand for it falls and when price of a commodity falls demand for the commodity rises. Thus, there is an inverse relationship between price and quantity demanded.
Symbolically, the functional relationship between demand and price is expressed as :
Dx = f (Px)
Where D = Demand for a commodity
x = Commodity
f = Function
Px = Price of a commodity
Additional Information For better Understanding:
In other words, it can be said that if the price of a commodity reduces additional units of goods can be purchased. Eminent economist like Prof. Marshall has compared this law with a game of “See-Saw” in which he has stated that when one end of a plank of wood goes up the other end goes down.
The law of demand is explained with the help of the following demand schedule and diagram:
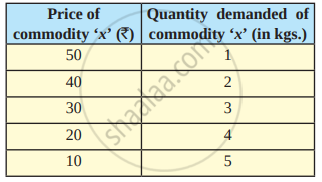
As shown in Table, when price of commodity ‘x’ is ` 50, quantity demanded is 1 kg. When price falls from ` 50 to ` 40, quantity demanded rises from 1 kg to 2 kgs. Similarly, at price ` 30, quantity demanded is 3 kgs and when price falls from ` 20 to ` 10, quantity demanded rises from 4 kg sto 5 kgs
Thus, as the price of a commodity falls,quantity demanded rises and when price of commodity rises, quantity demanded falls. This shows an inverse relationship between price and quantity demanded.

In the figure above, X-axis represents the demand for the commodity and Y axis represents the price of commodity x. DD is the demand curve which slopes downward from left to right due to an inverse relationship between price and quantity demanded.
Additional Information For better Understanding:
In other words, it can be said that if the price of a commodity reduces additional units of goods can be purchased. Eminent economist like Prof. Marshall has compared this law with a game of “See-Saw” in which he has stated that when one end of a plank of wood goes up the other end goes down.
For Better Understandng:
This Law of Demand can be expressed more clearly by an example, Suppose, the price of apples per dozen is ₹80, its demand is 1 dozen. When the price is ₹ 90 then half a dozen, ₹100 then 4; ₹110 then two, and so on. From the following table demand of apples can be studied clearly when there is increase and decrease in price.
| Price of apples per dozen | Demand for Apples based on the price | Conclusion |
| ₹ 80 | 1 dozen = 12 apples | Price ↓ Demand ↑ |
| ₹ 90 | Half dozen = 6 apples | Price ↑ Demand ↓ |
|
₹ 100 |
4 apples | Price ↑ Demand ↓ |
|
₹ 110 |
2 apples | Price ↑ Demand ↓ |
