Topics
Introduction to Micro and Macro Economics
Micro Economics
Macro Economics
Utility Analysis
- Utility
- Types of Utility
- Concepts of Utility
- Relationship Between Total Utility and Marginal Utility
- Law of Diminishing Marginal Utility
- Assumptions of Diminishing Marginal Utility
- Exceptions to the Law of Diminishing Marginal Utility
- Criticisms of the Diminishing Marginal Utility
- Significance of the Diminishing Marginal Utility
- Relationship Between Marginal Utility and Price
- Diminishing Marginal Utility
Demand Analysis
Elasticity of Demand
Supply Analysis
Forms of Market
Index Numbers
National Income
- Concept of National Income
- Features of National Income
- Circular Flow of National Income
- Different Concepts of National Income
- Methods of Measurement of National Income
- Output Method/Product Method
- Income Method
- Expenditure Method
- Difficulties in the Measurement of National Income
- Importance of National Income Analysis
Public Finance in India
Money Market and Capital Market in India
- Financial Market
- Money Market in India
- Structure of Money Market in India
- Organized Sector
- Reserve Bank of India (RBI)
- Commercial Banks
- Co-operative Banks
- Development Financial Institutions (DFIs)
- Discount and Finance House of India (DFHI)
- Unorganized Sector
- Role of Money Market in India
- Problems of the Indian Money Market
- Reforms Introduced in the Money Market
- Capital Market
- Structure of Capital Market in India
- Role of Capital Market in India
- Problems of the Capital Market
- Reforms Introduced in the Capital Market
Foreign Trade of India
- Internal Trade
- Foreign Trade of India
- Types of Foreign Trade
- Role of Foreign Trade
- Composition of India’s Foreign Trade
- Direction of India’s Foreign Trade
- Trends in India’s Foreign Trade since 2001
- Concept of Balance of Payments (BOP)
Introduction to Micro Economics
- Features of Micro Economics
- Analysis of Market Structure
- Importance of Micro Economics
- Micro Economics - Slicing Method
- Use of Marginalism Principle in Micro Economics
- Micro Economics - Price Theory
- Micro Economic - Price Determination
- Micro Economics - Working of a Free Market Economy
- Micro Economics - International Trade and Public Finance
- Basis of Welfare Economics
- Micro Economics - Useful to Government
- Assumption of Micro Economic Analysis
- Meaning of Micro and Macro Economics
Consumers Behavior
Analysis of Demand and Elasticity of Demand
Analysis of Supply
Types of Market and Price Determination Under Perfect Competition
- Market
- Forms of Market
- Market Forms - Duopoly
- Equilibrium Price
Factors of Production
- Factors of Production - Land
- Factors of Production: Labour
- Factors of Production: Capital
- Factors of Production - Feature of Capital
- Factors of Production - Organisation
Introduction to Macro Economics
- Features of Macro Economic
- Importance of Macro Economic
- Difference Between Mirco Economic and Macro Economic
- Allocation of Resource and Economic Variable
National Income
Determinants of Aggregates
- Total Demand for Good and Services
- Concept of Aggregate Demand and Aggregate Supply
- Consumption Demand
- Investment Demand
- Government Demand
- Foreign Demand
- Difference Betweeen Export and Import
- Effect of Population of Consumption Expediture
- Types of Investment Expenditure
- Micro Eco-Equilibrium
Money
- Meaning of Money
- Type of Money
- Primary Function
- Secondary Functions
- Standard of Deferred Payment
- Standard of Transfer Payment
- Money - Store of Value
- Concept of Barter Exchange
- Difficulties Involved in the Barter Exchange
- Monetary Payments
- Concept of Good Money
Commercial Bank
Central Bank
- Definition - Central Bank
- Central Bank Function - Banker's Bank
- Central Bank Function - Controller of Credit
- Monetary Function of Central Bank
- Non Monetary Function of Central Bank
- Method of Credit Control - Quantitative
- Repo Rate and Reverse Repo Rate
- Central Bank Function - Goverment Bank
Public Economics
- Introduction of Public Economics
- Features of Public Economics
- Meaning of Government Budget
- Objectives of Government Budget
- Features of Government Budget
- Public Economics - Budget (1 Year)(1 April to 31 March)
- Types of Budget
- Taxable Income
- Budgetary Accounting in India
- Budgetary Accounting - Consolidated , Contingency and Public Fund
- Components of Budget
- Factor Influencing Government Budget
Notes
Changes in Demand :
When demand for a commodity increases or decreases due to changes in other factors and price remains constant, it is known as changes in demand. It is of two types :
1) Increase in demand :
It refers to an increase in quantity demanded due to favourable changes in other factors like tastes, the income of the consumer, climatic conditions etc. and price remains constant. Demand curve shifts to the right-hand side of the original demand curve. This can be explained with the help of a figure.
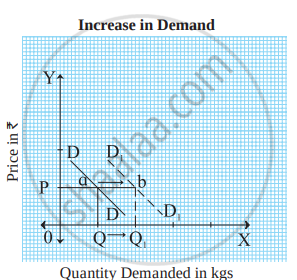
As shown in figure, DD is the original demand curve. Demand curve shifts outward to the right from DD to D1 D1 which indicates increase in demand.
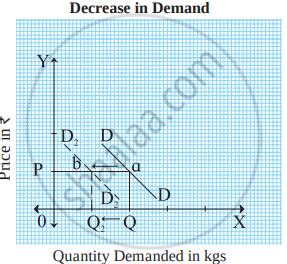
2) Decrease in demand :
It refers to decrease in quantity demanded due to unfavourable changes in other factors like tastes, income of the consumer, climatic conditions etc. and price remains constant. Demand curve shifts to left hand side of the original demand curve. This can be explained with the help of figure
As shown in figure, DD is the original demand curve. Demand curve shifts outward to the right from DD to D1 D1 which indicates increase in demand.
For Better Understanding:
| Increase in Demand | Decrease in Demand |
|
When more quantity is demanded than before at the same price, it is called an increase in demand. |
When less quantity is demanded than before at the same price, it is called a decrease in demand. |
| Increase in demand takes place due to favourable changes in factors other than price like fashion, income, taxation policy, advertisements, etc. | Decrease in demand takes place due to unfavourable changes in factors other than price like fashion, income, taxation policy, advertisements, etc. |
| An increase in demand is indicated by a shift in the demand curve to the right. | A decrease in demand is indicated by a shift in the demand curve to left. |
When there is an increase in demand, the demand curve shifts to the right from DD to D1D2 as shown in the figure.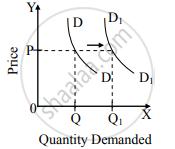 |
When there is a decrease in demand the demand curve shift to the left from DD to D2D2 as shown in the figure.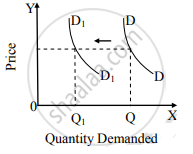 |
