Topics
Physical World and Measurement
Physical World
Units and Measurements
- International System of Units
- Measurement of Length
- Measurement of Mass
- Measurement of Time
- Accuracy, Precision and Least Count of Measuring Instruments
- Errors in Measurements
- Significant Figures
- Dimensions of Physical Quantities
- Dimensional Formulae and Dimensional Equations
- Dimensional Analysis and Its Applications
- Need for Measurement
- Units of Measurement
- Fundamental and Derived Units
- Length, Mass and Time Measurements
- Introduction of Units and Measurements
Motion in a Straight Line
- Position, Path Length and Displacement
- Average Velocity and Average Speed
- Instantaneous Velocity and Speed
- Kinematic Equations for Uniformly Accelerated Motion
- Acceleration (Average and Instantaneous)
- Relative Velocity
- Elementary Concept of Differentiation and Integration for Describing Motion
- Uniform and Non-uniform Motion
- Uniformly Accelerated Motion
- Position-time, Velocity-time and Acceleration-time Graphs
- Position - Time Graph
- Relations for Uniformly Accelerated Motion (Graphical Treatment)
- Introduction of Motion in One Dimension
- Motion in a Straight Line
Kinematics
Motion in a Plane
- Scalars and Vectors
- Multiplication of Vectors by a Real Number or Scalar
- Addition and Subtraction of Vectors - Graphical Method
- Resolution of Vectors
- Vector Addition – Analytical Method
- Motion in a Plane
- Motion in a Plane with Constant Acceleration
- Projectile Motion
- Uniform Circular Motion (UCM)
- General Vectors and Their Notations
- Motion in a Plane - Average Velocity and Instantaneous Velocity
- Rectangular Components
- Scalar (Dot) and Vector (Cross) Product of Vectors
- Relative Velocity in Two Dimensions
- Cases of Uniform Velocity
- Cases of Uniform Acceleration Projectile Motion
- Motion in a Plane - Average Acceleration and Instantaneous Acceleration
- Angular Velocity
- Introduction of Motion in One Dimension
Laws of Motion
Work, Energy and Power
Laws of Motion
- Aristotle’s Fallacy
- The Law of Inertia
- Newton's First Law of Motion
- Newton’s Second Law of Motion
- Newton's Third Law of Motion
- Conservation of Momentum
- Equilibrium of a Particle
- Common Forces in Mechanics
- Circular Motion and Its Characteristics
- Solving Problems in Mechanics
- Static and Kinetic Friction
- Laws of Friction
- Inertia
- Intuitive Concept of Force
- Dynamics of Uniform Circular Motion - Centripetal Force
- Examples of Circular Motion (Vehicle on a Level Circular Road, Vehicle on a Banked Road)
- Lubrication - (Laws of Motion)
- Law of Conservation of Linear Momentum and Its Applications
- Rolling Friction
- Introduction of Motion in One Dimension
Work, Energy and Power
- Introduction of Work, Energy and Power
- Notions of Work and Kinetic Energy: the Work-energy Theorem
- Kinetic Energy (K)
- Work Done by a Constant Force and a Variable Force
- Concept of Work
- Potential Energy (U)
- Conservation of Mechanical Energy
- Potential Energy of a Spring
- Various Forms of Energy : the Law of Conservation of Energy
- Power
- Collisions
- Non - Conservative Forces - Motion in a Vertical Circle
Motion of System of Particles and Rigid Body
System of Particles and Rotational Motion
- Motion - Rigid Body
- Centre of Mass
- Motion of Centre of Mass
- Linear Momentum of a System of Particles
- Vector Product of Two Vectors
- Angular Velocity and Its Relation with Linear Velocity
- Torque and Angular Momentum
- Equilibrium of Rigid Body
- Moment of Inertia
- Theorems of Perpendicular and Parallel Axes
- Kinematics of Rotational Motion About a Fixed Axis
- Dynamics of Rotational Motion About a Fixed Axis
- Angular Momentum in Case of Rotation About a Fixed Axis
- Rolling Motion
- Momentum Conservation and Centre of Mass Motion
- Centre of Mass of a Rigid Body
- Centre of Mass of a Uniform Rod
- Rigid Body Rotation
- Equations of Rotational Motion
- Comparison of Linear and Rotational Motions
- Values of Moments of Inertia for Simple Geometrical Objects (No Derivation)
Gravitation
Gravitation
- Kepler’s Laws
- Newton’s Universal Law of Gravitation
- The Gravitational Constant
- Acceleration Due to Gravity of the Earth
- Acceleration Due to Gravity Below and Above the Earth's Surface
- Acceleration Due to Gravity and Its Variation with Altitude and Depth
- Gravitational Potential Energy
- Escape Speed
- Earth Satellites
- Energy of an Orbiting Satellite
- Geostationary and Polar Satellites
- Weightlessness
- Escape Velocity
- Orbital Velocity of a Satellite
Properties of Bulk Matter
Mechanical Properties of Solids
- Elastic Behaviour of Solid
- Stress and Strain
- Hooke’s Law
- Stress-strain Curve
- Young’s Modulus
- Determination of Young’s Modulus of the Material of a Wire
- Shear Modulus or Modulus of Rigidity
- Bulk Modulus
- Application of Elastic Behaviour of Materials
- Elastic Energy
- Poisson’s Ratio
Thermodynamics
Behaviour of Perfect Gases and Kinetic Theory of Gases
Mechanical Properties of Fluids
- Thrust and Pressure
- Pascal’s Law
- Variation of Pressure with Depth
- Atmospheric Pressure and Gauge Pressure
- Hydraulic Machines
- Streamline and Turbulent Flow
- Applications of Bernoulli’s Equation
- Viscous Force or Viscosity
- Reynold's Number
- Surface Tension
- Effect of Gravity on Fluid Pressure
- Terminal Velocity
- Critical Velocity
- Excess of Pressure Across a Curved Surface
- Introduction of Mechanical Properties of Fluids
- Archimedes' Principle
- Stoke's Law
- Equation of Continuity
- Torricelli's Law
Oscillations and Waves
Thermal Properties of Matter
- Heat and Temperature
- Measurement of Temperature
- Ideal-gas Equation and Absolute Temperature
- Thermal Expansion
- Specific Heat Capacity
- Calorimetry
- Change of State - Latent Heat Capacity
- Conduction
- Convection
- Radiation
- Newton’s Law of Cooling
- Qualitative Ideas of Black Body Radiation
- Wien's Displacement Law
- Stefan's Law
- Anomalous Expansion of Water
- Liquids and Gases
- Thermal Expansion of Solids
- Green House Effect
Thermodynamics
- Thermal Equilibrium
- Zeroth Law of Thermodynamics
- Heat, Internal Energy and Work
- First Law of Thermodynamics
- Specific Heat Capacity
- Thermodynamic State Variables and Equation of State
- Thermodynamic Process
- Heat Engine
- Refrigerators and Heat Pumps
- Second Law of Thermodynamics
- Reversible and Irreversible Processes
- Carnot Engine
Kinetic Theory
- Molecular Nature of Matter
- Gases and Its Characteristics
- Equation of State of a Perfect Gas
- Work Done in Compressing a Gas
- Introduction of Kinetic Theory of an Ideal Gas
- Interpretation of Temperature in Kinetic Theory
- Law of Equipartition of Energy
- Specific Heat Capacities - Gases
- Mean Free Path
- Kinetic Theory of Gases - Concept of Pressure
- Assumptions of Kinetic Theory of Gases
- RMS Speed of Gas Molecules
- Degrees of Freedom
- Avogadro's Number
Oscillations
- Periodic and Oscillatory Motion
- Simple Harmonic Motion (S.H.M.)
- Simple Harmonic Motion and Uniform Circular Motion
- Velocity and Acceleration in Simple Harmonic Motion
- Force Law for Simple Harmonic Motion
- Energy in Simple Harmonic Motion
- Some Systems Executing Simple Harmonic Motion
- Damped Simple Harmonic Motion
- Forced Oscillations and Resonance
- Displacement as a Function of Time
- Periodic Functions
- Oscillations - Frequency
- Simple Pendulum
Waves
- Reflection of Transverse and Longitudinal Waves
- Displacement Relation for a Progressive Wave
- The Speed of a Travelling Wave
- Principle of Superposition of Waves
- Introduction of Reflection of Waves
- Standing Waves and Normal Modes
- Beats
- Doppler Effect
- Wave Motion
- Speed of Wave Motion
Notes
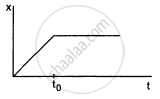
The Position-Time Graph
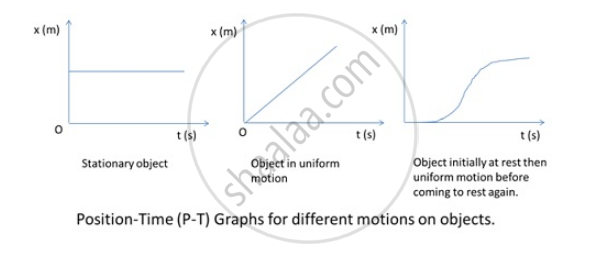
The position-time graph describes the motion of an object over a period of time. Time in seconds is conventionally plotted on the x-axis and the position of the object in meters is plotted along the y-axis. The slope of the position-time graph reveals important information about the velocity of the object.
Slope of the Position-Time Graph
The slope of a position-time graph reveals the type of velocity an object undergoes during its motion. A constant slope of a position-time graph indicates a constant velocity. A varying slope of a position-time graph indicates a changing velocity. The direction of the slope of the position-time graph indicates the sign of the velocity. For example, if it slopes downward, from left to right, the velocity is negative.
The Velocity-Time Graph
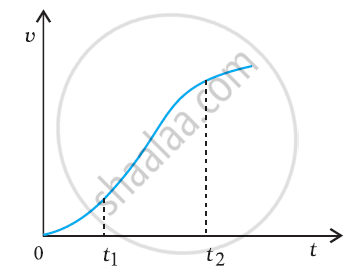
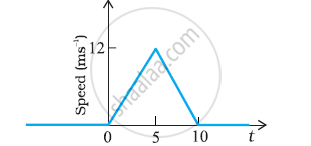
The velocity-time graph of an object reveals the speed at which an object is moving at a given time and whether it is slowing down or speeding up. Time in seconds is usually plotted on the x-axis while the velocity in meters per second is usually plotted along the y-axis. Objects moving at a constant rate have a straight-line velocity-time graph. Objects moving at variable speeds have sloping, linear velocity graphs.
Slope of the Velocity-Time Graph
The slope of the velocity-time graph reveals the acceleration of an object. If the slope of the velocity-time graph is a horizontal line, the acceleration is 0. This means the object is either at rest or moving at a constant speed, without speeding up or slowing down. If the slope is positive, the acceleration is increasing. If slope is negative, acceleration is decreasing.
(a) Since the velocity-time graph is a straight line, the body has uniform velocity.
(b)The body has uniform acceleration and its initial velocity is zero because the line starts from the origin.
(c)The body has some initial velocity and is under uniform retardation.
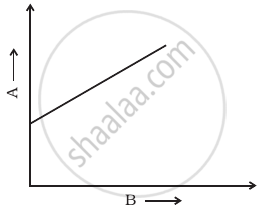
(d)The body has some initial velocity and uniform acceleration.
(e)The body has zero initial velocity and it has variable acceleration.
(f)The body is at rest from O to A, it has uniform acceleration from A to B, it has uniform velocity from B to C and from C to D, the body is under uniform retardation.
The Acceleration-Time Graph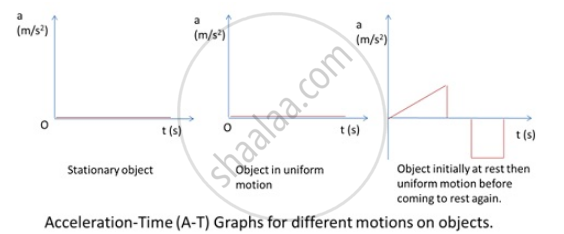
The vertical axis represents the acceleration of the object.
Slope of the Acceleration-Time Graph
The slope of an acceleration graph represents a quantity called the jerk. The jerk is the rate of change of the acceleration.
The slope of an acceleration graph represents a quantity called the jerk. The jerk is the rate of change of the acceleration.
For an acceleration graph, the slope can be found from
`slope=(rise)/(run)=(a_2-a_1)/(t_2-t_1)=(Δa)/(Δt),`
as can be seen in the diagram below. This slope, which represents the rate of change of acceleration, is defined to be the jerk.
`jerk=(Δa)/(Δt)`
The area under an acceleration graph represents the change in velocity. In other words, the area under the acceleration graph for a certain time interval is equal to the change in velocity during that time interval.
`area=Δv`