मराठी

Anomalous Behaviour of Water

Advertisements

Topics

  • Introduction
  • Graph between the Volume and Temperature of Water
  • Experiment 1
  • Experiment 2
  • Importance of Anomalous Behaviour of Water

Introduction:

Water exhibits an unusual property known as the anomalous behaviour of water, which plays a crucial role in nature. Unlike most substances that contract when cooled, water behaves differently in the 0°C to 4°C temperature range. This unique property helps aquatic life survive in cold climates and has significant real-world implications.

  • Generally, liquids expand when heated and contract when cooled as their density increases. However, water contracts only until it reaches 4°C.
  • At 4°C, water has its maximum density. When cooled below 4°C, water expands instead of contracting, reducing its density.
  • This means ice (formed at 0°C) is less dense than water, which is why ice floats on water.

Effect of Anomalous Behaviour in Water Bodies

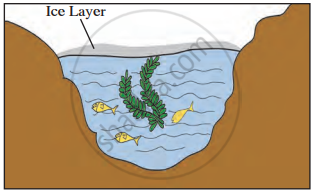
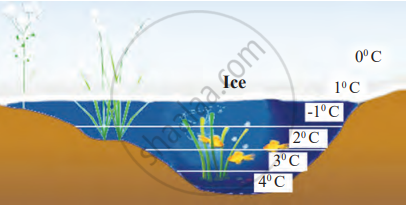
  • At 4°C, the densest water moves to the bottom of lakes, rivers, and ponds.
  • Colder water (below 4°C) remains on the surface, and freezing starts from the top layer.
  • This forms a layer of ice that insulates the water beneath, preventing the entire water body from freezing.
  • As a result, aquatic life survives even when the surface is frozen.

Anomalous behaviour

Graph between the volume and temperature of water

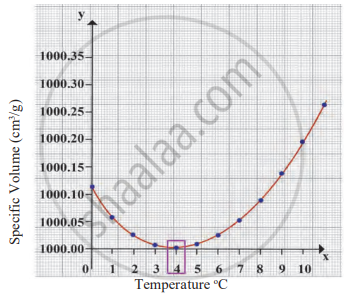
The graph plots the specific volume of water (y-axis) against temperature (x-axis).

  • As water is heated from 0°C to 4°C, the graph shows a decrease in volume, meaning water contracts, and its density increases.
  • At 4°C, the graph reaches its lowest point, indicating the minimum volume and maximum density of water.
  • Beyond 4°C, the volume starts increasing, showing that water expands as it follows normal thermal expansion.

Thus, the statement "At 4°C, the volume of water is minimum. It means that the density of water is maximum at 4°C" is accurately represented by the graph and correctly describes the anomalous expansion of water.

Graph between the volume and temperature of water

Experiment 1

1. Aim: To understand how the density of water changes when salt is dissolved and how it affects the floating or sinking of objects, like a potato.

2. Requirements: two large glasses of water, 4-5 spoonfuls of salt, a potato, and a spoon for stirring.

3. Procedure

  • Fill two glasses with water.
  • Add 4-5 spoonfuls of salt to one of the glasses and stir until the salt completely dissolves.
  • Place a potato in the plain water (the second glass) and observe it sinking to the bottom.
  • Now, take the potato out and place it in the saltwater glass. Observe what happens.

4. Observation: In the plain water, the potato sinks because the water's density is less than the potato's. However, in the salt water, the potato floats. This is because adding salt increases the density of the water, making it easier for the potato to float.

5. Conclusion: The experiment shows that adding salt to water increases its density, allowing objects like a potato to float more easily. This explains why it is easier to swim in the sea, which has salty water, than in a lake or well with fresh water. When salt dissolves in water, its particles spread throughout the water, mixing completely, which is known as dissolving. The salt (solute) dissolves in the water (solvent) to form a solution.
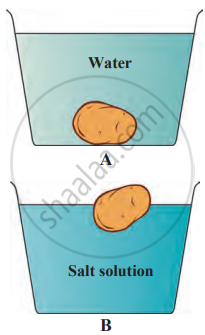
 Effect of density

Experiment 2

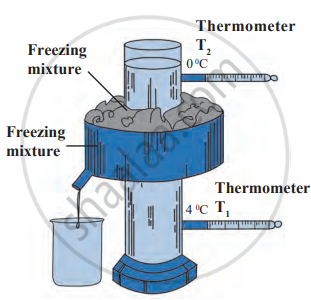
1. Aim: To study the anomalous behaviour of water using Hope’s apparatus by observing temperature changes in different parts of a water column.

2. Requirements

  • Hope’s Apparatus (a cylindrical container with a central cooling chamber)
  • Thermometers (T₁ and T₂)
  • Water
  • Ice-salt mixture (freezing mixture)

3. Procedure

i. Fill the cylindrical container with water.

ii. Insert two thermometers:

  • T₁ at the bottom to measure lower water temperature.
  • T₂ at the top to measure upper water temperature.

iii. Add a freezing mixture (ice + salt) in the central chamber to start cooling.

iv. Record the temperatures of T₁ and T₂ every 30 seconds until freezing begins.

Hope’s Apparatus

Time-Temperature Graph

Aquatic animals in cold regions

4. Observations

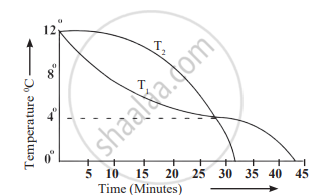
  • Initially, T₁ and T₂ are identical.
  • T₁ (bottom temperature) decreases rapidly until 4°C, then remains stable for a while.
  • T₂ (top temperature) decreases gradually, reaching 0°C first before T₁.
  • Once T₂ reaches 0°C, T₁ starts decreasing further, confirming that freezing begins at the top.

Conclusion

  • Water at 4°C is the heaviest, so it sinks to the bottom, while colder water moves upward.
  • T₁ stabilising at 4°C shows that denser water remains at the bottom, preventing it from freezing immediately.
  • T₂ reaching 0°C first confirms that ice forms at the top first.
  • Since liquid water remains below the ice, aquatic animals can survive in lakes and ponds during winter.

Importance of Anomalous Behaviour of Water

  1. Survival of Aquatic Life: In cold environments, lakes freeze from the top, keeping the bottom layer at 4°C, ensuring fish and aquatic organisms survive.
  2. Ice Floats on Water: Ice is less dense than water, allowing it to float, which prevents complete freezing of lakes and rivers.
  3. Prevention of Water Body Freezing: The top layer of ice acts as an insulator, slowing further freezing and protecting life below.
  4. Weather and Climate Regulation: The high heat capacity of water and its unique density variations help regulate Earth’s temperature.
  5. Expansion of Water When Freezing: This property causes water pipes to burst in cold weather because frozen water expands.
If you would like to contribute notes or other learning material, please submit them using the button below.
Advertisements
Share
Notifications

Englishहिंदीमराठी


      Forgot password?
Use app×