Topics
Field Visit
Location and Extent
Physiography and Drainage
- Physical Divisions of India
- The North Indian Mountains
- The Himalayas
- North Indian Plains
- The Peninsular Indian Plateau
- The Indian Coastal Plains
- The Indian Islands
- Physiography of Brazil
- Brazilian Highlands
- The Great Escarpment in Brazil
- Coastline of Brazil
- Brazilian Plains
- Brazilian Island
- Drainage of Brazil
- Drainage Systems of India
- Himalayan Rivers
- Peninsular Rivers
Climate
Natural Vegetation and Wildlife
Population
Human Settlements
Economy and Occupations
Tourism, Transport and Communication
Geography - Physical Divisions of India
Identification of Physical divisions
- Identification of Physical Divisions
Geography - North Indian Mountains
Himalayas
Associated mountains
- Concept of Associated Mountains
Geography - North Indian Plain Region
Deserts
- Desert
Western Plains
- Concept of Western Plains
Central Plains
- Concept on Central Plains
Delta region
- Concept of Delta Region
Eastern Plains
- Concept of Eastern Plains
Geography - Peninsular Plateau Region
Chhotta Nagpur Plateau
- Concept for Chhotta Nagpur Plateau
Malwa Plateau
- Concept on Malwa Plateau
Maharashtra Plateau
- Concept for Maharashtra Plateau
Karnataka Plateau
- Concept for Karnataka Plateau
Telangana Plateau
- Concept for Telangana Plateau
Geography - Western Ghats and Eastern Ghats
Eastern Ghats
- Concept on Eastern Ghats
Sahyadries
- Concept on Sahyadries
Geography - Coastal Region
- Geography - Coastal Region
Eastern coastal plain
- Coastal Region - Eastern Coastal Plain
- Concept for Western Coastal Plain
Western coastal plain
- Concept for Western Coastal Plain
Geography - Indian Islands
- Geography - Indian Islands
Eastern Islands
- Indian Islands - Eastern Islands
Western Islands
- Indian Islands - Western Islands
Geography - Practical 1
Cartography
- Concept on Cartography
Geography - Practical 2
Two dimensional diagrams
- Two Dimensional Shapes
One dimensional diagrams
- Concept on One Dimensional Diagrams
Economics - Introduction of an Economy
Introduction of an Economy
- Economy
- Types of Economy
- Main Features of Economy
Economics - Basic problems of an economy solution
Solutions
- Concept for Capitalism
- Concept for Socialism
- Mixed Economy
Problems
- Introduction of Basic Problems of an Economy
- Problems- for Whom to Produce
- Problem - How Much to Produce
- Problem - by Whom to Produce
Economics - Inflation
Introduction
- Introduction of Inflation
Effects of inflation
- Effects of Inflation
Measures of Inflation
- Measures of Inflation
Causes of inflation
- Causes of Inflation
Economics - Public distribution system and consumer protection
- Measures of Inflation
Public Distribution system - meaning and explanation
- Public Distribution System - Meaning and Explanation
Introduction
- Introduction of Public Distribution System and Consumer Protection
Objectives of Public Distribution system
- Objectives of Public Distribution System
Remedial Measures
- Remedial Measures Public Distribution System and Consumer Protection
Consumer Protection
- Consumer Protection - Rights and Duties of Cunsumer, Food Adulteration
Drawbacks of Public Distribution system
- Drawbacks of Public Distribution System
Progress of Public Distribution system
- Progress of Public Distribution System
Notes
Economic Activities in Brazil and India
|
Per Capita Income from 1960 to 2016 ( in US $) |
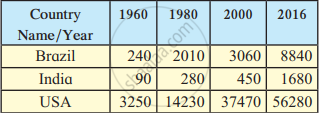
- A country's economy is dependent on the economic activities that take place in the country. An economy has three types of economic activities.
- Compared to Brazil, India has a higher national income. Brazil is one of the world giants of mining, agriculture, and manufacturing, and it has a strong and rapidly growing service sector. However, despite the country's growing service sector, India continues to be reliant on agriculture.
- The Brazilian economy is a mixed economy, just like the Indian one. The economies of Brazil and India are both developing economies. Their per capita incomes are very less as compared to the developed countries like the USA. It's interesting to note that despite having a higher national income than Brazil, India has a lower per capita income.
- The United States is one of the developed nations. This country's people are well educated. This country is strong in terms of patents, modern technology, and mechanical strength. In terms of national per capita income, this country is far ahead of Brazil and India.
- India and Brazil are both developing country. These countries are making progress in technological advancement, education, and industry. The national per capita income of countries is low. Because India is so large, per capita income appears to be even lower.
Example
Read the following graph and answer the questions:
- Which country’s national income was highest in 2016 and was it how much?
- Comparing India and Brazil, which country had a higher national income in 1980?
- Comparing India and Brazil, which country had a higher income in 2016?
- Tell the difference between the GNP of Brazil and India in 2016.
- Calculate the difference between the national incomes of developed and developing countries in 2016.
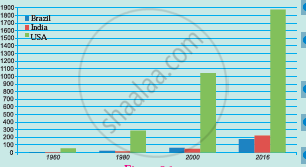
a. National income is the money value of all the final goods and services produced within the domestic territory of the country during a particular period of time, generally within a year. In 2016, the national income of the US was the highest. It was nearly 1900 million US dollars.
b. National income is the money value of all the final goods and services produced within the domestic territory of the country during a particular period of time, generally within a year. In 1980, Brazil had a higher national income compared to India. The difference between their incomes is only negligible.
c. National income is the money value of all the final goods and services produced within the domestic territory of the country during a particular period of time, generally within a year. In 2016, India had a higher national income compared to Brazil. The national income of India has just crossed 200 million US dollars, while the national income of Brazil is reaching 200 million US dollars.
d. National income is the money value of all the final goods and services produced within the domestic territory of the country during a particular period of time, generally within a year. In 2016, India had a higher national income compared to Brazil. The national income of India has just crossed 200 million US dollars, while the national income of Brazil is reaching 200 million US dollars.
e. National income is the money value of all the final goods and services produced within the domestic territory of the country during a particular period of time, generally within a year. The US is a developed economy while both Brazil and India are developing countries. There is a huge gap between the national incomes of both developed and developing countries. In 2016, the US had a national income of nearly 1900 million US dollars, but the national income of India has just crossed 200 million US dollars. There exists a huge gap between the two amounting to about 1700 million US dollars.
Example
A table regarding the ownership of various sectors in both the countries is given. Like Brazil, fill the details regarding India and complete the table.
| Sr.No. | India | Sector | Brazil |
| 1. | -- | Banking | Private and public both |
| 2. | -- | Railways | Private and public both |
| 3. | -- | Airways | Private and public both |
| 4. | -- | Electricity production | Largely public |
| 5. | -- | Iron and Steel Industry | Largely public |
| 6. | -- | Health | Private and public both |
| 7. | -- | Education | Largely public, little private |
| 8. | -- | Telecommuni-cations | Private and public both |
- On the basis of the information about the ownership of various sectors in both the countries given in the table, can you infer about the type of these economies?
| Sr.No. | India | Sector | Brazil |
| 1. | Private and Public both | Banking | Private and public both |
| 2. | Largely Public | Railways | Private and public both |
| 3. | Largely Private Little Public | Airways | Private and public both |
| 4. | Private and Public both | Electricity production | Largely public |
| 5. | Private and Public both | Iron and Steel Industry | Largely public |
| 6. | Private and Public both | Health | Private and public both |
| 7. | Largely Private and Public | Education | Largely public, little private |
| 8. | Largely Private and little Public | Telecommunications | Private and public both |
1. By analysing this table it is quite obvious that there exist mixed economy in both the countries as in this an economic system is combined by both private as well as public enterprise.
Example
Classify the following activities in by ticking (✓) in the respective column.
| Activities | Primary | Secondary | Tertiary |
| Television Broadcasting | |||
| Bee-keeping | |||
| coir and Rope making | |||
| Jaggery- making | |||
| Producing blades of the plough. |
|||
| Construction | |||
| Extracting Iron Ore | |||
| Automobile Production | |||
| Rice Production | |||
| Teaching | |||
| Driving buses | |||
| Providing lodging and boarding facilities |
| Activities | Primary | Secondary | Tertiary |
| Television Broadcasting | ✓ | ||
| Bee-keeping | ✓ | ||
| coir and Rope making | ✓ | ||
| Jaggery- making | ✓ | ||
| Producing blades of the plough. |
✓ | ||
| Construction | ✓ | ||
| Extracting Iron Ore | ✓ | ||
| Automobile Production | ✓ | ||
| Rice Production | ✓ | ||
| Teaching | ✓ | ||
| Driving buses | ✓ | ||
| Providing lodging and boarding facilities |
✓ |
Example
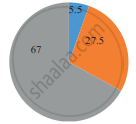
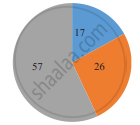
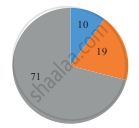
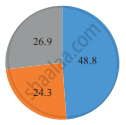
In figure given below, the pie-charts show the contribution of each sector in the respective country’s GDP and the percentage of population engaged in various activities. Read both the pie-charts carefully and answer the following questions.
| Brazil | India |
 |
 |
| Contribution of sectors in GDP (2016) | |
 |
 |
| Percentage of population engaged in various sectors (2016) | |
 Primary Primary  Secondary Secondary  Tertiary Tertiary |
|
- Which country has a higher percentage of population engaged in primary activities?
- In which country is the contribution of tertiary sector greater in the GDP?
- In which country is the share of secondary activities more in the GDP?
- Can we say that Brazil is an agrarian economy like India? Give reasons.
- India has a higher percentage of population engaged in primary activities (48.8%).
- The contribution of tertiary sector is greater in Brazil’s GDP (67%).
- The contribution of secondary activities is more in Brazil’s GDP (27.5%).
- Brazil is not an agrarian economy like India. This is because 71% of its population is engaged in the tertiary sector and it contributes 67% in GDP.
Related QuestionsVIEW ALL [27]
A table regarding the ownership of various sectors in both the countries is given. Like Brazil, fill the details regarding India and complete the table.
| Sr.No. | India | Sector | Brazil |
| 1. | -- | Banking | Private and public both |
| 2. | -- | Railways | Private and public both |
| 3. | -- | Airways | Private and public both |
| 4. | -- | Electricity production | Largely public |
| 5. | -- | Iron and Steel Industry | Largely public |
| 6. | -- | Health | Private and public both |
| 7. | -- | Education | Largely public, little private |
| 8. | -- | Telecommuni-cations | Private and public both |
- On the basis of the information about the ownership of various sectors in both the countries given in the table, can you infer about the type of these economies?
