Advertisements
Chapters
2: Polynomials
3: Coordinate Geometry
4: Linear Equation In Two Variables
5: Introduction To Euclid's Geometry
6: Lines & Angles
7: Triangles
8: Quadrilaterals
9: Areas of Parallelograms & Triangles
10: Circles
11: Construction
12: Heron's Formula
13: Surface Area & Volumes
▶ 14: Statistics & Probability
![NCERT Exemplar solutions for Mathematics [English] Class 9 chapter 14 - Statistics & Probability - Shaalaa.com](/images/mathematics-english-class-9_6:5f2b1b2038084cf381bfa42c826a928c.jpg "NCERT Exemplar solutions for Mathematics [English] Class 9 chapter 14 - Statistics & Probability")
Advertisements
Solutions for Chapter 14: Statistics & Probability
Below listed, you can find solutions for Chapter 14 of CBSE NCERT Exemplar for Mathematics [English] Class 9.
NCERT Exemplar solutions for Mathematics [English] Class 9 14 Statistics & Probability Exercise 14.1 [Pages 131 - 136]
Choose the correct alternative:
The class mark of the class 90 – 120 is ______.
90
105
115
120
The range of the data: 25, 18, 20, 22, 16, 6, 17, 15, 12, 30, 32, 10, 19, 8, 11, 20 is ______.
10
15
18
26
In a frequency distribution, the mid-value of a class is 10 and the width of the class is 6. The lower limit of the class is ______.
6
7
8
12
The width of each of five continuous classes in a frequency distribution is 5 and the lower class-limit of the lowest class is 10. The upper class-limit of the highest class is ______.
15
25
35
40
Let m be the mid-point and l be the upper-class limit of a class in a continuous frequency distribution. The lower class limit of the class is ______.
2m + l
2m – l
m – l
m – 2l
The class marks of a frequency distribution are given as follows: 15, 20, 25, ... The class corresponding to the class mark 20 is ______.
12.5 – 17.5
17.5 – 22.5
18.5 – 21.5
19.5 – 20.5
In the class intervals 10 – 20, 20 – 30, the number 20 is included in ______.
10 – 20
20 – 30
both the intervals
none of these intervals
A grouped frequency table with class intervals of equal sizes using 250 – 270 (270 not included in this interval) as one of the class interval is constructed for the following data:
268, 220, 368, 258, 242, 310, 272, 342, 310, 290, 300, 320, 319, 304, 402, 318, 406, 292, 354, 278, 210, 240, 330, 316, 406, 215, 258, 236.
The frequency of the class 310 – 330 is:
4
5
6
7
A grouped frequency distribution table with classes of equal sizes using 63 – 72 (72 included) as one of the class is constructed for the following data:
30, 32, 45, 54, 74, 78, 108, 112, 66, 76, 88, 40, 14, 20, 15, 35, 44, 66, 75, 84, 95, 96, 102, 110, 88, 74, 112, 14, 34, 44.
The number of classes in the distribution will be:
9
10
11
12
To draw a histogram to represent the following frequency distribution:
| Class interval | 5 – 10 | 10 – 15 | 15 – 25 | 25 – 45 | 45 – 75 |
| Frequency | 6 | 12 | 10 | 8 | 15 |
the adjusted frequency for the class 25 – 45 is:
6
5
3
2
The mean of five numbers is 30. If one number is excluded, their mean becomes 28. The excluded number is ______.
28
30
35
38
If the mean of the observations: x, x + 3, x + 5, x + 7, x + 10 is 9, the mean of the last three observations is ______.
`10 1/3`
`10 2/3`
`11 1/3`
`11 2/3`
If `barx` represents the mean of n observations x1, x2, ..., xn, then value of `sum_(i = 1)^n (x_i - barx)` is ______.
–1
0
1
n – 1
If each observation of the data is increased by 5, then their mean ______.
remains the same
becomes 5 times the original mean
is decreased by 5
is increased by 5
Let `barx` be the mean of x1, x2, ..., xn and `bary` the mean of y1, y2, ..., yn. If `barz` is the mean of x1, x2, ..., xn, y1, y2, ..., yn, then `barz` is equal to ______.
`barx + bary`
`(barx + bary)/2`
`(barx + bary)/n`
`(barx + bary)/(2n)`
If `barx` is the mean of x1, x2, ..., xn, then for a ≠ 0, the mean of `ax_1, ax_2, ..., ax_n, x_1/a, x_2/a, ..., x_n/a` is ______.
`(a + 1/a)barx`
`(a + 1/a) barx/2`
`(a + 1/a)barx/n`
`((a + 1/a)barx)/(2n)`
If `barx_1, barx_2, barx_3, ..., barx_n` are the means of n groups with n1, n2, ..., nn number of observations respectively, then the mean `barx` of all the groups taken together is given by ______.
`sum_(i = 1)^n n_i barx_i`
`(sum_(i = 1)^n n_i barx_i)/n^2`
`(sum_(i = 1)^n n_i barx_i)/(sum_(i = 1)^n n_i)`
`(sum_(i = 1)^n n_i barx_i)/(2n)`
The mean of 100 observations is 50. If one of the observations which was 50 is replaced by 150, the resulting mean will be ______.
50.5
51
51.5
52
There are 50 numbers. Each number is subtracted from 53 and the mean of the numbers so obtained is found to be –3.5. The mean of the given numbers is ______.
46.5
49.5
53.5
56.5
The mean of 25 observations is 36. Out of these observations if the mean of first 13 observations is 32 and that of the last 13 observations is 40, the 13th observation is ______.
23
36
38
40
The median of the data 78, 56, 22, 34, 45, 54, 39, 68, 54, 84 is ______.
45
49.5
54
56
For drawing a frequency polygon of a continous frequency distribution, we plot the points whose ordinates are the frequencies of the respective classes and abcissae are respectively ______.
upper limits of the classes
lower limits of the classes
class marks of the classes
upper limits of perceeding classes
Median of the following numbers: 4, 4, 5, 7, 6, 7, 7, 12, 3 is ______.
4
5
6
7
Mode of the data 15, 14, 19, 20, 14, 15, 16, 14, 15, 18, 14, 19, 15, 17, 15 is ______.
14
15
16
17
In a sample study of 642 people, it was found that 514 people have a high school certificate. If a person is selected at random, the probability that the person has a high school certificate is ______.
0.5
0.6
0.7
0.8
In a survey of 364 children aged 19 – 36 months, it was found that 91 liked to eat potato chips. If a child is selected at random, the probability that he/she does not like to eat potato chips is ______.
0.25
0.50
0.75
0.80
In a medical examination of students of a class, the following blood groups are recorded:
| Blood group | A | AB | B | O |
| Number of students | 10 | 13 | 12 | 5 |
A student is selected at random from the class. The probability that he/she has blood group B, is:
`1/4`
`13/40`
`3/10`
`1/8`
Two coins are tossed 1000 times and the outcomes are recorded as below:
| Number of heads | 2 | 1 | 0 |
| Frequency | 200 | 550 | 250 |
Based on this information, the probability for at most one head is
`1/5`
`1/4`
`4/5`
`3/4`
80 bulbs are selected at random from a lot and their life time (in hrs) is recorded in the form of a frequency table given below:
| Life time (in hours) | 300 | 500 | 700 | 900 | 1100 |
| Frequency | 10 | 12 | 23 | 25 | 10 |
One bulb is selected at random from the lot. The probability that its life is 1150 hours, is
`1/80`
`7/16`
0
1
80 bulbs are selected at random from a lot and their life time (in hrs) is recorded in the form of a frequency table given below :
| Life time (in hours) | 300 | 500 | 700 | 900 | 1100 |
| Frequency | 10 | 12 | 23 | 25 | 10 |
The probability that bulbs selected randomly from the lot has life less than 900 hours is:
`11/40`
`5/16`
`7/16`
`9/16`
NCERT Exemplar solutions for Mathematics [English] Class 9 14 Statistics & Probability Exercise 14.2 [Pages 136 - 138]
The frequency distribution has been represented graphically as follows:
| Marks | 0 – 20 | 20 – 40 | 40 – 60 | 60 – 100 |
| Number of Students | 10 | 15 | 20 | 25 |
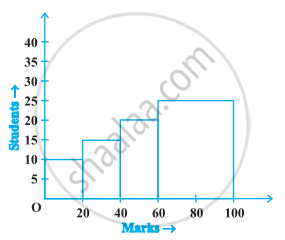
Do you think this representation is correct? Why?
In a diagnostic test in mathematics given to students, the following marks (out of 100) are recorded:
46, 52, 48, 11, 41, 62, 54, 53, 96, 40, 98, 44
Which ‘average’ will be a good representative of the above data and why?
A child says that the median of 3, 14, 18, 20, 5 is 18. What doesn’t the child understand about finding the median?
A football player scored the following number of goals in the 10 matches:
1, 3, 2, 5, 8, 6, 1, 4, 7, 9
Since the number of matches is 10 (an even number), therefore, the median
= `(5^("th") "observation" + 6^("th") "observation")/2`
= `(8 + 6)/2` = 7
Is it the correct answer and why?
Is it correct to say that in a histogram, the area of each rectangle is proportional to the class size of the corresponding class interval? If not, correct the statement.
The class marks of a continuous distribution are:
1.04, 1.14, 1.24, 1.34, 1.44, 1.54 and 1.64
Is it correct to say that the last interval will be 1.55 – 1.73? Justify your answer.
30 children were asked about the number of hours they watched TV programmes last week. The results are recorded as under:
| Number of hours | 0 – 5 | 5 – 10 | 10 – 15 | 15 – 20 |
| Frequency | 8 | 16 | 4 | 2 |
Can we say that the number of children who watched TV for 10 or more hours a week is 22? Justify your answer.
Can the experimental probability of an event be a negative number? If not, why?
Can the experimental probability of an event be greater than 1? Justify your answer.
As the number of tosses of a coin increases, the ratio of the number of heads to the total number of tosses will be `1/2`. Is it correct? If not, write the correct one.
NCERT Exemplar solutions for Mathematics [English] Class 9 14 Statistics & Probability Exercise 14.3 [Pages 140 - 144]
The blood groups of 30 students are recorded as follows:
A, B, O, A, AB, O, A, O, B, A, O, B, A, AB, B, A, AB, B, A, A, O, A, AB, B, A, O, B, A, B, A
Prepare a frequency distribution table for the data.
The value of π upto 35 decimal places is given below:
3.14159265358979323846264338327950288
Make a frequency distribution of the digits 0 to 9 after the decimal point.
The scores (out of 100) obtained by 33 students in a mathematics test are as follows:
69, 48, 84, 58, 48, 73, 83, 48, 66, 58, 84, 66, 64, 71, 64, 66, 69, 66, 83, 66, 69, 71, 81, 71, 73, 69, 66, 66, 64, 58, 64, 69, 69
Represent this data in the form of a frequency distribution.
Prepare a continuous grouped frequency distribution from the following data:
| Mid-point | Frequency |
| 5 | 4 |
| 15 | 8 |
| 25 | 13 |
| 35 | 12 |
| 45 | 6 |
Also find the size of class intervals.
Convert the given frequency distribution into a continuous grouped frequency distribution:
| Class interval | Frequency |
| 150 – 153 | 7 |
| 154 – 157 | 7 |
| 158 – 161 | 15 |
| 162 – 165 | 10 |
| 166 – 169 | 5 |
| 170 – 173 | 6 |
In which intervals would 153.5 and 157.5 be included?
The expenditure of a family on different heads in a month is given below:
| Head | Food | Education | Clothing | House Rent | Others | Savings |
| Expenditure (in Rs) |
4000 | 2500 | 1000 | 3500 | 2500 | 1500 |
Draw a bar graph to represent the data above.
Expenditure on Education of a country during a five year period (2002-2006), in crores of rupees, is given below:
| Elementary education | 240 |
| Secondary Education | 120 |
| University Education | 190 |
| Teacher’s Training | 20 |
| Social Education | 10 |
| Other Educational Programmes | 115 |
| Cultural programmes | 25 |
| Technical Education | 125 |
Represent the information above by a bar graph.
The following table gives the frequencies of most commonly used letters a, e, i, o, r, t, u from a page of a book:
| Letters | a | e | i | o | r | t | u |
| Frequency | 75 | 125 | 80 | 70 | 80 | 95 | 75 |
Represent the information above by a bar graph.
If the mean of the following data is 20.2, find the value of p:
| x | 10 | 15 | 20 | 25 | 30 |
| f | 6 | 8 | p | 10 | 6 |
Obtain the mean of the following distribution:
| Frequency | Variable |
| 4 | 4 |
| 8 | 6 |
| 14 | 8 |
| 11 | 10 |
| 3 | 12 |
A class consists of 50 students out of which 30 are girls. The mean of marks scored by girls in a test is 73 (out of 100) and that of boys is 71. Determine the mean score of the whole class.
Mean of 50 observations was found to be 80.4. But later on, it was discovered that 96 was misread as 69 at one place. Find the correct mean.
Ten observations 6, 14, 15, 17, x + 1, 2x – 13, 30, 32, 34, 43 are written in an ascending order. The median of the data is 24. Find the value of x.
The points scored by a basket ball team in a series of matches are as follows:
17, 2, 7, 27, 25, 5, 14, 18, 10, 24, 48, 10, 8, 7, 10, 28
Find the median and mode for the data.
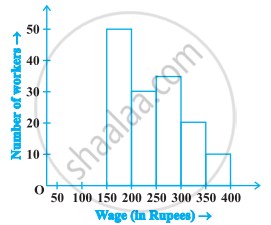
In the following figure, there is a histogram depicting daily wages of workers in a factory. Construct the frequency distribution table.
A company selected 4000 households at random and surveyed them to find out a relationship between income level and the number of television sets in a home. The information so obtained is listed in the following table:
| Monthly income (in Rs) |
Number of Television/household | |||
| 0 | 1 | 2 | Above 2 | |
| < 10000 | 20 | 80 | 10 | 0 |
| 10000 – 14999 | 10 | 240 | 60 | 0 |
| 15000 – 19999 | 0 | 380 | 120 | 30 |
| 20000 – 24999 | 0 | 520 | 370 | 80 |
| 25000 and above | 0 | 1100 | 760 | 220 |
Find the probability:
- of a household earning Rs 10000 – Rs 14999 per year and having exactly one television.
- of a household earning Rs 25000 and more per year and owning 2 televisions.
- of a household not having any television.
Two dice are thrown simultaneously 500 times. Each time the sum of two numbers appearing on their tops is noted and recorded as given in the following table:
| Sum | Frequency |
| 2 | 14 |
| 3 | 30 |
| 4 | 42 |
| 5 | 55 |
| 6 | 72 |
| 7 | 75 |
| 8 | 70 |
| 9 | 53 |
| 10 | 46 |
| 11 | 28 |
| 12 | 15 |
If the dice are thrown once more, what is the probability of getting a sum
- 3?
- more than 10?
- less than or equal to 5?
- between 8 and 12?
Bulbs are packed in cartons each containing 40 bulbs. Seven hundred cartons were examined for defective bulbs and the results are given in the following table:
| Number of defective bulbs | 0 | 1 | 2 | 3 | 4 | 5 | 6 | more than 6 |
| Frequency | 400 | 180 | 48 | 41 | 18 | 8 | 3 | 2 |
One carton was selected at random. What is the probability that it has
- no defective bulb?
- defective bulbs from 2 to 6?
- defective bulbs less than 4?
Over the past 200 working days, the number of defective parts produced by a machine is given in the following table:
| Number of defective parts |
0 | 1 | 2 | 3 | 4 | 5 | 6 | 7 | 8 | 9 | 10 | 11 | 12 | 13 |
| Days | 50 | 32 | 22 | 18 | 12 | 12 | 10 | 10 | 10 | 8 | 6 | 6 | 2 | 2 |
Determine the probability that tomorrow’s output will have
- no defective part
- atleast one defective part
- not more than 5 defective parts
- more than 13 defective parts
A recent survey found that the ages of workers in a factory is distributed as follows:
| Age (in years) | 20 – 29 | 30 – 39 | 40 – 49 | 50 – 59 | 60 and above |
| Number of workers | 38 | 27 | 86 | 46 | 3 |
If a person is selected at random, find the probability that the person is:
- 40 years or more
- under 40 years
- having age from 30 to 39 years
- under 60 but over 39 years
NCERT Exemplar solutions for Mathematics [English] Class 9 14 Statistics & Probability Exercise 14.4 [Pages 147 - 149]
The following are the marks (out of 100) of 60 students in mathematics.
16, 13, 5, 80, 86, 7, 51, 48, 24, 56, 70, 19, 61, 17, 16, 36, 34, 42, 34, 35, 72, 55, 75, 31, 52, 28, 72, 97, 74, 45, 62, 68, 86, 35, 85, 36, 81, 75, 55, 26, 95, 31, 7, 78, 92, 62, 52, 56, 15, 63, 25, 36, 54, 44, 47, 27, 72, 17, 4, 30.
Construct a grouped frequency distribution table with width 10 of each class starting from 0 – 9.
The following are the marks (out of 100) of 60 students in mathematics.
16, 13, 5, 80, 86, 7, 51, 48, 24, 56, 70, 19, 61, 17, 16, 36, 34, 42, 34, 35, 72, 55, 75, 31, 52, 28, 72, 97, 74, 45, 62, 68, 86, 35, 85, 36, 81, 75, 55, 26, 95, 31, 7, 78, 92, 62, 52, 56, 15, 63, 25, 36, 54, 44, 47, 27, 72, 17, 4, 30.
Construct a grouped frequency distribution table with width 10 of each class, in such a way that one of the classes is 10 – 20 (20 not included).
Draw a histogram of the following distribution:
| Heights (in cm) | Number of students |
| 150 – 153 | 7 |
| 153 – 156 | 8 |
| 156 – 159 | 14 |
| 159 – 162 | 10 |
| 162 – 165 | 6 |
| 165 – 168 | 5 |
Draw a histogram to represent the following grouped frequency distribution:
| Ages (in years) | Number of teachers |
| 20 – 24 | 10 |
| 25 – 29 | 28 |
| 30 – 34 | 32 |
| 35 – 39 | 48 |
| 40 – 44 | 50 |
| 45 – 49 | 35 |
| 50 – 54 | 12 |
The lengths of 62 leaves of a plant are measured in millimetres and the data is represented in the following table:
| Length (in mm) | Number of leaves |
| 118 – 126 | 8 |
| 127 – 135 | 10 |
| 136 – 144 | 12 |
| 145 – 153 | 17 |
| 154 – 162 | 7 |
| 163 – 171 | 5 |
| 172 – 180 | 3 |
Draw a histogram to represent the data above.
The marks obtained (out of 100) by a class of 80 students are given below:
| Marks | Number of students |
| 10 – 20 | 6 |
| 20 – 30 | 17 |
| 30 – 50 | 15 |
| 50 – 70 | 16 |
| 70 – 100 | 26 |
Construct a histogram to represent the data above.
Following table shows a frequency distribution for the speed of cars passing through at a particular spot on a high way:
| Class interval (km/h) | Frequency |
| 30 – 40 | 3 |
| 40 – 50 | 6 |
| 50 – 60 | 25 |
| 60 – 70 | 65 |
| 70 – 80 | 50 |
| 80 – 90 | 28 |
| 90 – 100 | 14 |
Draw a histogram and frequency polygon representing the data above.
Following table shows a frequency distribution for the speed of cars passing through at a particular spot on a high way:
| Class interval (km/h) | Frequency |
| 30 – 40 | 3 |
| 40 – 50 | 6 |
| 50 – 60 | 25 |
| 60 – 70 | 65 |
| 70 – 80 | 50 |
| 80 – 90 | 28 |
| 90 – 100 | 14 |
Draw the frequency polygon representing the above data without drawing the histogram.
Following table gives the distribution of students of sections A and B of a class according to the marks obtained by them.
| Section A | Section B | ||
| Marks | Frequency | Marks | Frequency |
| 0 – 15 | 5 | 0 – 15 | 3 |
| 15 – 30 | 12 | 15 – 30 | 16 |
| 30 – 45 | 28 | 30 – 45 | 25 |
| 45 – 60 | 30 | 45 – 60 | 27 |
| 60 –75 | 35 | 60 – 75 | 40 |
| 75 – 90 | 13 | 75 – 90 | 10 |
Represent the marks of the students of both the sections on the same graph by two frequency polygons. What do you observe?
The mean of the following distribution is 50.
| x | f |
| 10 | 17 |
| 30 | 5a + 3 |
| 50 | 32 |
| 70 | 7a – 11 |
| 90 | 19 |
Find the value of a and hence the frequencies of 30 and 70.
The mean marks (out of 100) of boys and girls in an examination are 70 and 73, respectively. If the mean marks of all the students in that examination is 71, find the ratio of the number of boys to the number of girls.
A total of 25 patients admitted to a hospital are tested for levels of blood sugar, (mg/dl) and the results obtained were as follows:
| 87 | 71 | 83 | 67 | 85 |
| 77 | 69 | 76 | 65 | 85 |
| 85 | 54 | 70 | 68 | 80 |
| 73 | 78 | 68 | 85 | 73 |
| 81 | 78 | 81 | 77 | 75 |
Find mean, median and mode (mg/dl) of the above data.
Solutions for 14: Statistics & Probability
NCERT Exemplar solutions for Mathematics [English] Class 9 chapter 14 - Statistics & Probability
Shaalaa.com has the CBSE Mathematics Mathematics [English] Class 9 CBSE solutions in a manner that help students grasp basic concepts better and faster. The detailed, step-by-step solutions will help you understand the concepts better and clarify any confusion. NCERT Exemplar solutions for Mathematics Mathematics [English] Class 9 CBSE 14 (Statistics & Probability) include all questions with answers and detailed explanations. This will clear students' doubts about questions and improve their application skills while preparing for board exams.
Further, we at Shaalaa.com provide such solutions so students can prepare for written exams. NCERT Exemplar textbook solutions can be a core help for self-study and provide excellent self-help guidance for students.
Concepts covered in Mathematics [English] Class 9 chapter 14 Statistics & Probability are Presentation of Data, Graphical Representation of Data, Measures of Central Tendency, Collecting Data, Concepts of Statistics, Probability - an Experimental Approach.
Using NCERT Exemplar Mathematics [English] Class 9 solutions Statistics & Probability exercise by students is an easy way to prepare for the exams, as they involve solutions arranged chapter-wise and also page-wise. The questions involved in NCERT Exemplar Solutions are essential questions that can be asked in the final exam. Maximum CBSE Mathematics [English] Class 9 students prefer NCERT Exemplar Textbook Solutions to score more in exams.
Get the free view of Chapter 14, Statistics & Probability Mathematics [English] Class 9 additional questions for Mathematics Mathematics [English] Class 9 CBSE, and you can use Shaalaa.com to keep it handy for your exam preparation.
